| ||||
The HBS Toolkit Lifetime Customer Value Calculator tool is designed to let the user estimate the cost of acquiring a customer and the Net Present Value (NPV) of that customer's business during his useful economic life. Two models are offered—a simple one that looks at a single product and somewhat simplified assumptions, and a more complex model that allows the user to examine multiple products with distinct customer loyalty and repurchase characteristics.
The models assume that customer acquisition is done through a spending program that could include advertisements, special discount coupons or giving out of free samples. The user must make some assumptions about how much it costs the company to reach each potential customer as well as what percentage of customers reached will make an initial purchase. If there are additional costs (such as a rebate) that only apply to actual customers, those are also calculated. This provides a total cost per acquired customer.
The customer value calculation is similar to a perpetuity function. At each potential repurchase period, the user must estimate how many existing customers will continue to buy, a percentage known as Retention Rate. After adjusting for price inflation, this gives us all the components we need for the perpetuity formula. In the simple model the customer is considered to have an infinite economic life, although this is not too great a distortion unless retention rates are extremely high. (Even at 80% retention, a customer is almost 90% ‘used up' after just ten years.)
In the complex model, the user can assign a specific useful economic life to a customer, set multiple retention rates for different years, and look at the value of a customer for a company with multiple products. The calculation page then separates the profitability of the customer on an annual basis and by product, as well as breaking up customer present value by product.
For more detailed directions place your mouse above the red celltips located throughout the tool.
To start using the tool, remove the sample data from the tool using the Show/Hide Sample Data option under the HBS Menu.
Note About Using Internet Explorer
The default setting in Internet Explorer is to open these tools in the Explorer application instead of Excel. We recommend against this and suggest the following directions to alter your settings:
- Double-click My Computer.
- On the View menu, click Options (or Folder Options).
- Click the File Types tab.
- In the Registered File Types box, click the specific Office document type (for example, Microsoft Excel Worksheet), and then click Edit.
- In Internet Explorer 3.01, 3.02, or 3.02a, click the Open Web Documents In Place check box to clear it. In Internet Explorer 4.0, 4.01, or 5, click the Browse In Same Window check box to clear it.NOTE: This check box is not available if you are running Internet Explorer version 3.0. If you are running Internet Explorer 3.0, upgrade to Internet Explorer 3.02 or later. For information about obtaining the latest version of Internet Explorer, visit the Microsoft Web site.
· · · ·
The HBS Toolkit
The Harvard Business School Toolkit is a suite of tools and information resources designed to provide a consistent source of high-quality analysis and electronic self-instructional resources. It was prepared originally to help HBS MBA students with case analysis at various stages in the course of their studies at the School.
The Toolkit includes self-instructional workbooks/tutorials designed to reinforce many of the fundamental concepts required for business analysis. In many cases they include lessons on how to use Microsoft Excel to analyze data. There are tools designed to be used with standard elements of business analysis, as well as advanced tools originally created for use with specific courses and cases.
Watch HBS Working Knowledge for more from the HBS Toolkit.
HBS Toolkit Standard Interface Conventions
The Harvard Business School Toolkit uses the following standard conventions for the web site user interface and spreadsheet models. The following conventions will help guide your use of the Tools.

As depicted in the screens above, most tools will contain:
- Introduction: The introduction screen includes the title of the tool, a table of contents for the workbook by spreadsheet tab, an executive summary-style concept introduction, and directions on how to use the tool.
- Analysis: The analysis screen is the primary data input screen and where many of the tools will also provide their output data. Here is where the user will be asked to select options about the type of analysis he/she wishes to carry-out and can perform sensitivity analysis.
- Chart: The chart screen is a graphical representation of the tool output. Some tools have interactive charting capabilities that allow the user to perform sensitivity analysis directly from the chart and then copy that data back into the model.
- Cell Shading: All tools utilize
consistent cell shading in order to clearly identify:
 Input Cells
 Calculated Cells
- Celltip Documentation: Tools are
documented using Celltip notation. When a user places
their cursor over a documented cell (denoted by the
presense of a red celltip)
 a documentation box
appears revealing information about the concept or
calulation occuring in the worksheet.
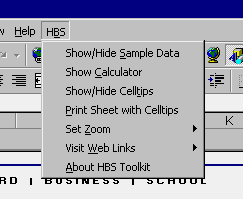
- HBS Menu: Each Tool contains a
special menu that is added to your Excel Toolbar when you
open the Tool. They contain the following resources:
- Show/Hide Sample Data (optional): Toggles in/out the sample data loaded into the tool (note: some tools will not include sample data.)
- Show Calculator: Launches Windows calculator for basic calculations
- Show/Hide Celltips: Toggles in/out red celltips in documented cells
- Print sheet with Celltips: Prints the worksheet you are currently viewing with its documentation cells
- Set Zoom: Provides quick access to 80%, 100%, and 125% zoom levels
- About HBS Toolkit: Launches the about box for the HBS Toolkit


